Γλώσσα
 Ελληνικά
Ελληνικά
Ελληνικά
LUNATICO ASTRONOMIA
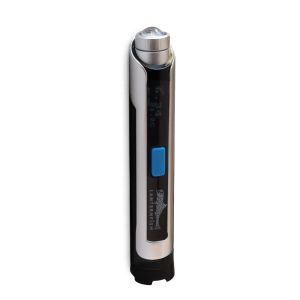
Lanternfish is a sky brightness monitor designed to measure sky brightness in MPSAS, log data autonomously, and provide easy access from any device via Wi-Fi. Unlike traditional sky quality meters, Lanternfish integrates all key functions into a single device.
Διαθέσιμο κατόπιν παραγγελίας

Lanternfish – Sky Brightness Monitor
Lanternfish is a sky brightness monitor designed to measure sky brightness in MPSAS (Magnitudes per square arcsecond), log data autonomously, and provide easy access from any device via Wi-Fi. Unlike traditional sky quality meters that require choosing between different models and features, Lanternfish integrates all key functions into a single device.
No versions. No add-ons. No compromises.
Features:
| Standalone Wi-Fi access point Lanternfish creates its own Wi-Fi network. Connect any phone, tablet or laptop directly — no router, no infrastructure. Or configure it to join your existing network. |
Automatic logging Records every measurement with date and time automatically. Night-by-night history with Max, Min and Average MPSAS — plus temperature — available for each session. |
Interactive graph with temperature Plot any night as an interactive MPSAS graph overlaid with temperature. Export graphs as PNG directly from the interface. Beautiful, data-rich, and instantly readable. |
| CSV data export Export any night's readings as a CSV file for analysis in your preferred tool — spreadsheets, Python, R. Full dataset including timestamp, MPSAS and temperature columns. |
OTA firmware updates Update Lanternfish firmware over the air directly from the web interface — no cables, no flashing tools needed. |
JSON API Access live readings and history via JSON — integrate Lanternfish data into your observatory automation software, dashboards or custom scripts. |
How to use
Point Lanternfish at the sky and take a reading either instantly or using a programmed mode.
The device automatically records data and allows access via its integrated web interface over Wi-Fi. Data can also be exported in CSV format.
Readings graph
Your whole night, at a glance
Lanternfish plots MPSAS and temperature for the whole night on a single graph — with the Lanternfish artwork in the background. Export as PNG directly from the interface.
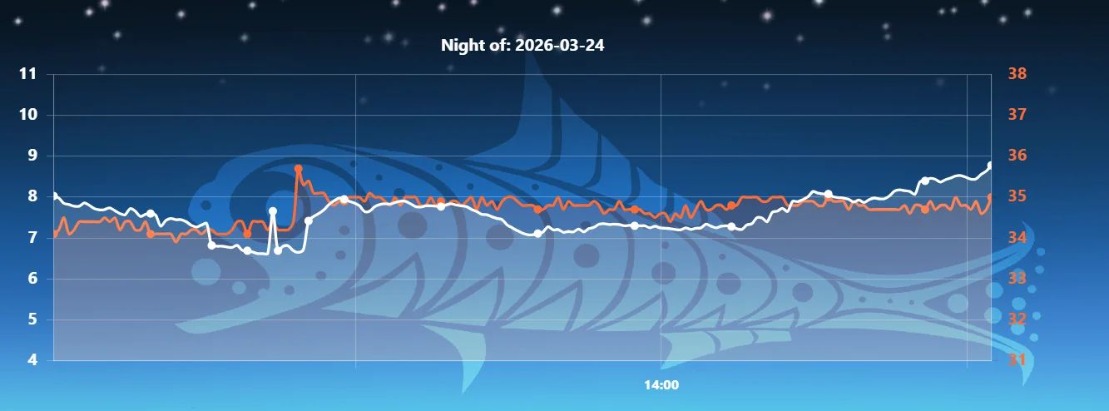
White line: MPSAS — sky brightness - Higher values = darker sky. A reading above 21 MPSAS indicates an excellent, Bortle 1–2 class site.
Orange line: Temperature - Recorded simultaneously with each sky measurement. Shown on the right-hand axis, useful for correlating sky conditions with local temperature changes.
Operating modes
From a quick read to a full night of data
Use Lanternfish for a single instant measurement or run it autonomously all night — with configurable stop triggers so it powers down when you want it to.
|
Quick Read Instant single reading |
Periodic Recording Configurable interval (e.g. every 30 s) |
Web interface
Access and control from any device
The Lanternfish web interface runs directly on the device — open it in any browser. No app to install, no account to create, no cloud dependency.
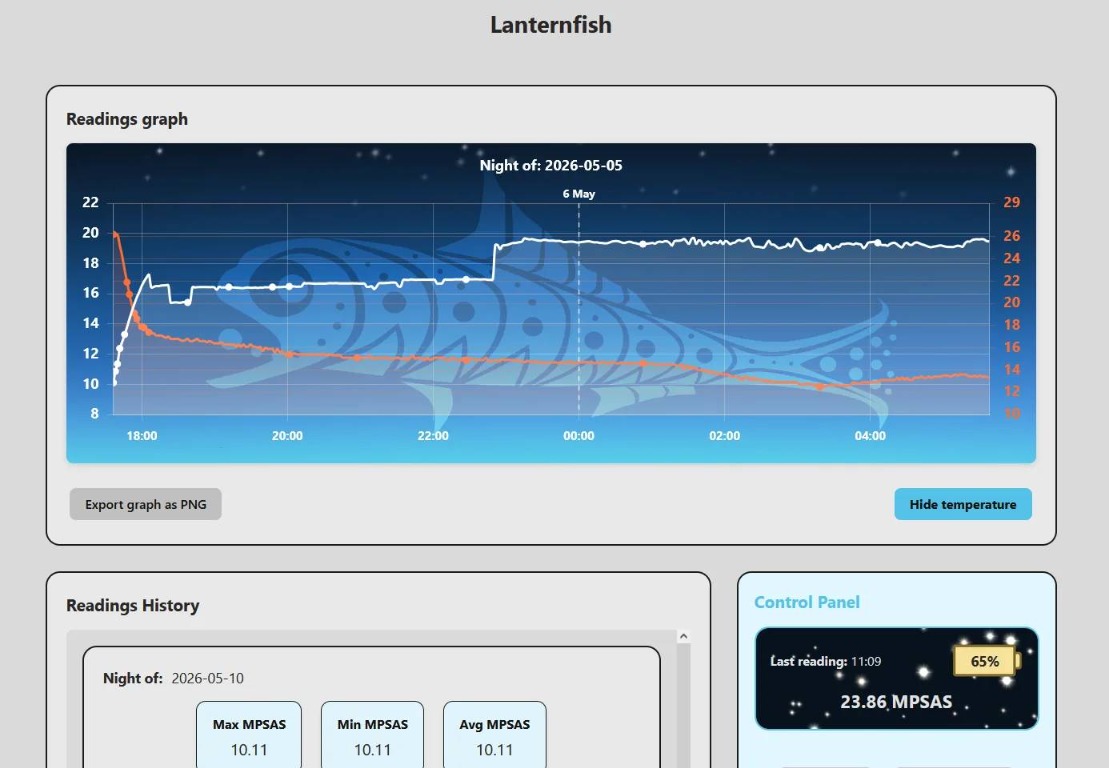
Night mode overview — readings graph with the full night plotted, history of previous sessions, and the live Control Panel showing the last MPSAS reading and battery level.
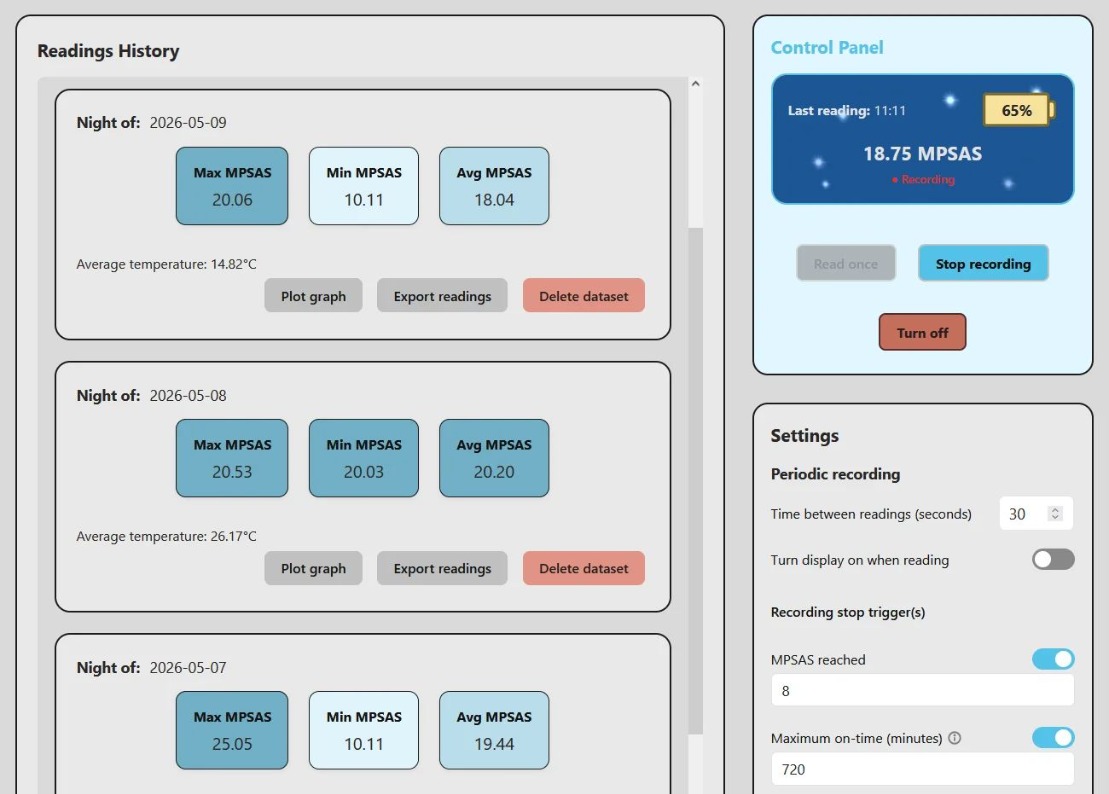
Readings History and live Control Panel — night-by-night summary with Max / Min / Avg MPSAS and temperature. The control panel shows the current reading and battery level at a glance.
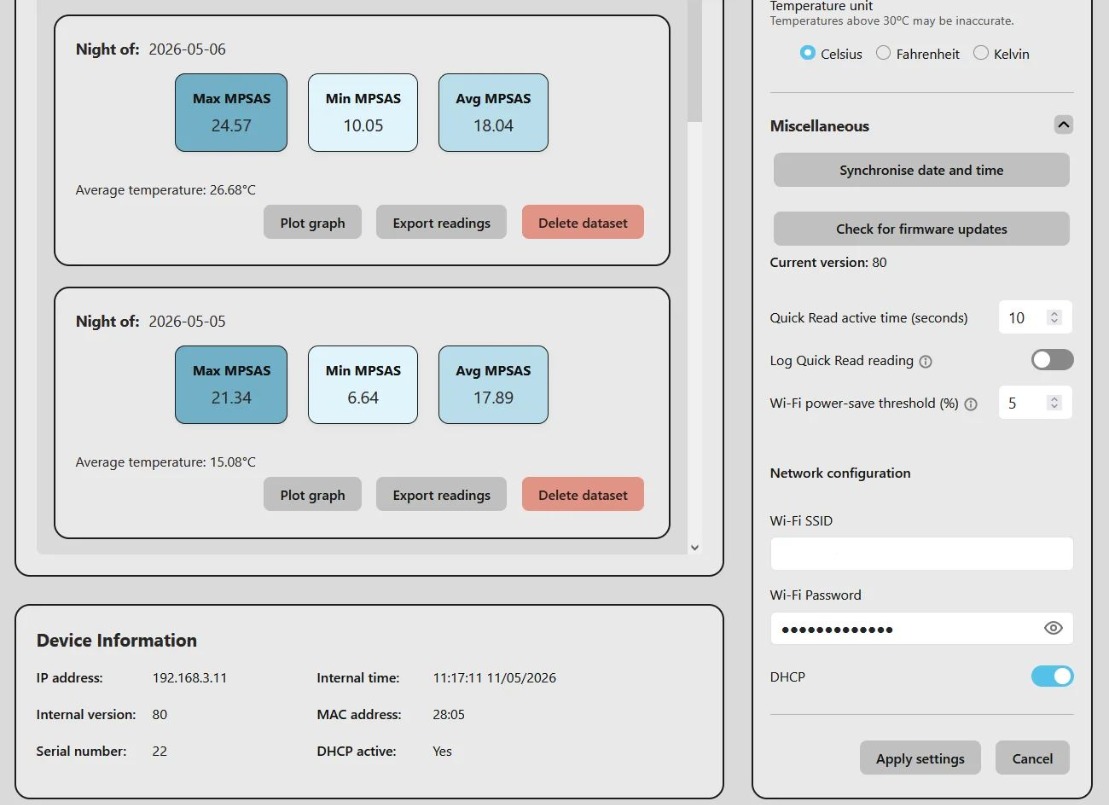
Settings panel — Wi-Fi network configuration, temperature unit, firmware version and OTA update. Device information including IP address, serial number and internal time.
Όλες οι παραγγελίες που δεχόμαστε μέχρι τις 15:00 και αφορούν προϊόντα που βρίσκονται στην αποθήκη μας, διεκπεραιώνονται την ίδια μέρα
Άρτια εκπαιδευμένο επιστημονικό και τεχνικό προσωπικό, είναι στη διάθεσή σας ανά πάσα στιγμή, για να λύσει τις απορίες και τους προβληματισμούς σας σχετικά με τον εξοπλισμό σας.
Σε περίπτωση που δεν μείνετε ικανοποιημένος/η από το προϊόν που παραλάβατε, μπορείτε να το επιστρέψετε εντός 14 ημερών από την ημερομηνία παραλαβής του.
Εμπειρία που εμπιστεύεστε . Το Πλανητάριο ΘΕΣΣΑΛΟΝΙΚΗΣ είναι ο μεγαλύτερος προμηθευτής ειδών αστρονομίας στα Βαλκάνια
 English